Contents
- 1 Cycling Performance Assessment: The Performance Plateau Crisis
- 1.1 Why Assessment Beats Random Training
- 1.2 Essential Testing Components
- 1.3 Power Profile Testing Protocol
- 1.4 Heart Rate Analysis Methods
- 1.5 Flexibility and Mobility Testing
- 1.6 Pedaling Efficiency Analysis
- 1.7 Aerobic Capacity Testing
- 1.8 Strength Imbalance Detection
- 1.9 Mental Performance Evaluation
- 1.10 Body Composition Analysis
- 1.11 Equipment and Position Assessment
- 1.12 Creating Your Testing Schedule
- 1.13 Analyzing Test Results Effectively
- 1.14 Common Assessment Mistakes
- 1.15 Professional Assessment Options
- 1.16 Goal Setting from Assessment Data
- 1.17 Tracking Progress Systematically
- 1.18 Conclusion: Assessment Drives Success
- 1.19 PRODUCTS TO ASSIST IN YOUR CYCLING PERFORMANCE ASSESSMENT
- 1.20 1. Garmin Rally RS200 Power Meter Pedals
- 1.21 2. Wahoo TICKR Heart Rate Monitor
- 1.22 3. Wahoo RPM Cadence Sensor
- 1.23 4. Garmin Edge 840 Bike Computer
Cycling Performance Assessment: The Performance Plateau Crisis

Most cyclists train blindly without proper cycling performance assessment. They repeat last year’s workouts expecting different results. This wastes precious training time.
Without identifying weaknesses, you strengthen existing strengths while ignoring critical limiters. Progress stalls. Frustration builds.
Cycling performance assessment transforms guesswork into targeted improvement.
Why Assessment Beats Random Training
Cycling performance assessment reveals hidden weaknesses blocking your potential. Maybe your anaerobic capacity limits sprint performance. Perhaps poor pedaling efficiency wastes valuable energy.
You can’t fix problems you don’t know exist.
Professional cyclists undergo comprehensive testing quarterly. They understand that data-driven training produces superior results.
Smart assessment guides smart training.
Essential Testing Components
Start with functional threshold power (FTP) testing. This 20-minute effort establishes training zones accurately.
Perform the test indoors for consistency. Warm up thoroughly for 20 minutes. Ride maximally for 20 minutes. Multiply average power by 0.95.
Your FTP forms the foundation of cycling performance assessment.
Power Profile Testing Protocol
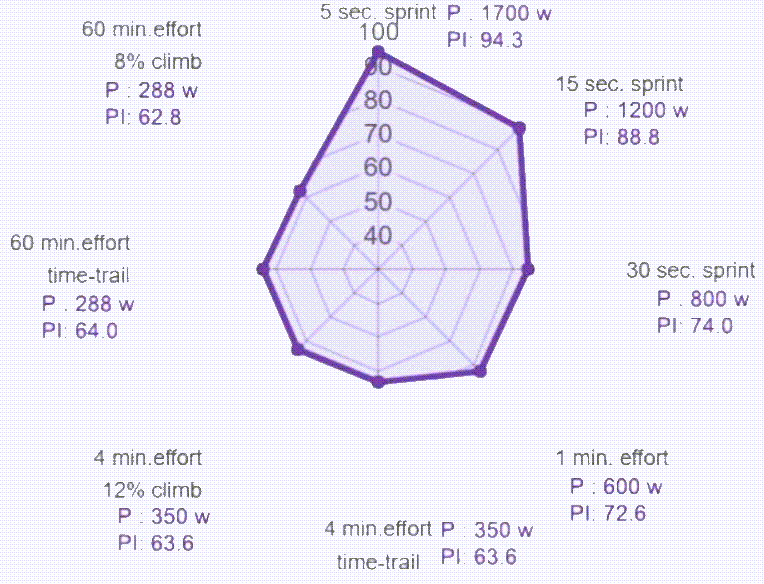
Test multiple durations to identify strengths and weaknesses comprehensively.
| Test Duration | Power System Tested | What It Reveals | Target W/kg |
| 5 seconds | Neuromuscular | Sprint capacity | 20-25 |
| 1 minute | Anaerobic | Short climb ability | 7-11 |
| 5 minutes | VO2 Max | Sustained efforts | 5-7 |
| 20 minutes | Threshold | Endurance power | 3.5-5 |
Compare results against established benchmarks. Cycling performance assessment requires honest evaluation.
Heart Rate Analysis Methods
Morning resting heart rate indicates recovery status. Track daily for two weeks minimum.
| HR Metric | Testing Method | Normal Range | What It Indicates |
| Resting HR | Morning measurement | 40-60 bpm | Recovery status |
| Max HR | Field test | 220-age (±10) | Training ceiling |
| HR Variability | HRV app | 20-100ms | Adaptation quality |
| Recovery HR | 1-min post effort | Drop >30 bpm | Fitness level |
Maximum heart rate testing requires caution. Perform only when fully recovered and healthy.
Document all metrics during cycling performance assessment.
Flexibility and Mobility Testing
Poor flexibility limits power production and increases injury risk.
| Body Area | Test Method | Good Range | Impact on Cycling |
| Hip Flexors | Thomas Test | <10° hip angle | Power production |
| Hamstrings | Straight Leg Raise | 80-90° | Pedal efficiency |
| Ankle | Wall Test | 10cm from wall | Pedal stroke |
| Lower Back | Sit & Reach | Touch toes | Aerodynamic position |
Include flexibility in comprehensive cycling performance assessment.
Pedaling Efficiency Analysis
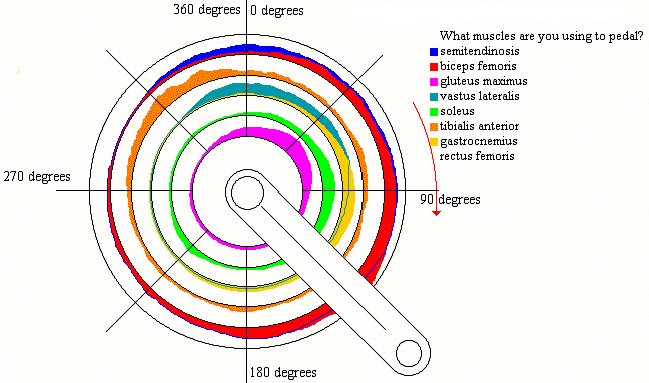
Mount your bike on a trainer. Pedal with one leg for 30 seconds. Switch legs.
Notice dead spots in your pedal stroke. Most cyclists lose power between 6-12 o’clock positions.
Video analysis reveals body position issues. Poor positioning reduces power significantly.
Cycling performance assessment must include technique evaluation.
Aerobic Capacity Testing
Perform a graduated exercise test if possible. Start at 100 watts. Increase 20 watts every minute until exhaustion.
| Fitness Level | VO2 Max (ml/kg/min) | Lactate Threshold (% of Max) | FTP (W/kg) |
| Beginner | 35-45 | 55-65% | 2.0-2.5 |
| Intermediate | 45-55 | 65-75% | 2.5-3.5 |
| Advanced | 55-65 | 75-85% | 3.5-4.5 |
| Elite | 65-80 | 85-95% | 4.5-6.0 |
Laboratory testing provides precise cycling performance assessment data.
Strength Imbalance Detection
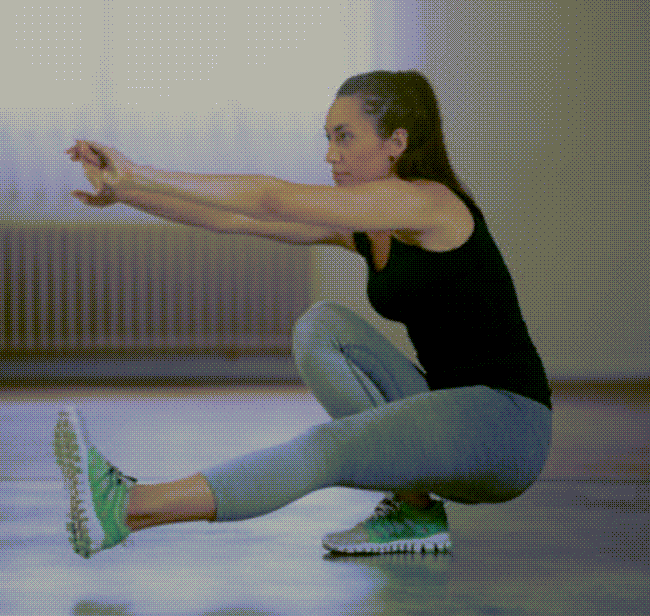
Single-leg squats reveal muscle imbalances. Perform 10 repetitions each leg.
| Strength Test | Method | Performance Standard | Common Issues |
| Single-Leg Squat | 10 reps each | <10% difference | Knee tracking |
| Plank Hold | Maximum time | 2+ minutes | Core weakness |
| Side Plank | Each side | 60+ seconds | Lateral stability |
| Glute Bridge | Single leg | 15 reps smooth | Hip weakness |
Address imbalances discovered during cycling performance assessment.
Mental Performance Evaluation
Rate motivation levels from 1-10 daily. Track patterns over several weeks.
Document stress responses during hard efforts. Mental limitations often precede physical failure.
Assess focus ability during long rides. Concentration affects performance significantly.
Psychological factors matter in cycling performance assessment.
Body Composition Analysis
Measure body fat percentage using reliable methods. DEXA scans provide accurate data.
| Category | Male Body Fat % | Female Body Fat % | Power/Weight Impact |
| Elite | 4-8% | 12-16% | Optimal |
| Competitive | 8-12% | 16-20% | Very Good |
| Recreational | 12-18% | 20-25% | Good |
| Fitness | 18-25% | 25-32% | Average |
Include composition metrics in cycling performance assessment.
Equipment and Position Assessment

Professional bike fitting reveals position inefficiencies. Small adjustments yield major improvements.
| Position Factor | Optimal Range | Testing Method | Performance Impact |
| Saddle Height | 25-30° knee angle | Goniometer | 5-10% power |
| Reach | Comfortable stretch | Flexibility test | Aerodynamics |
| Stack | Sustainable position | Time trial | Comfort/power |
| Cleat Position | Ball over pedal | Video analysis | Injury prevention |
Cycling performance assessment includes mechanical factors.
Creating Your Testing Schedule
| Week | Testing Focus | Duration | Recovery Needed |
| Week 1 | Baseline & Recovery | 30-45 min | 24 hours |
| Week 2 | Power Profile | 60-90 min | 48 hours |
| Week 3 | Aerobic & Efficiency | 90-120 min | 48 hours |
| Week 4 | Strength & Flexibility | 45-60 min | 24 hours |
Repeat cycling performance assessment every 8-12 weeks.
Analyzing Test Results Effectively
Compare results against previous tests. Look for trends, not single data points.
Identify your biggest limiter. Focus training on weakest areas first.
Set realistic improvement targets. 5-10% gains are substantial for experienced cyclists.
Use cycling performance assessment data to guide training decisions.
Common Assessment Mistakes
Mistake 1: Testing when fatigued. This provides inaccurate baseline data.
Mistake 2: Ignoring mental factors. Psychology affects performance profoundly.
Mistake 3: Over-testing. Monthly FTP tests create unnecessary fatigue.
Mistake 4: Dismissing flexibility and strength. These factors limit many cyclists.
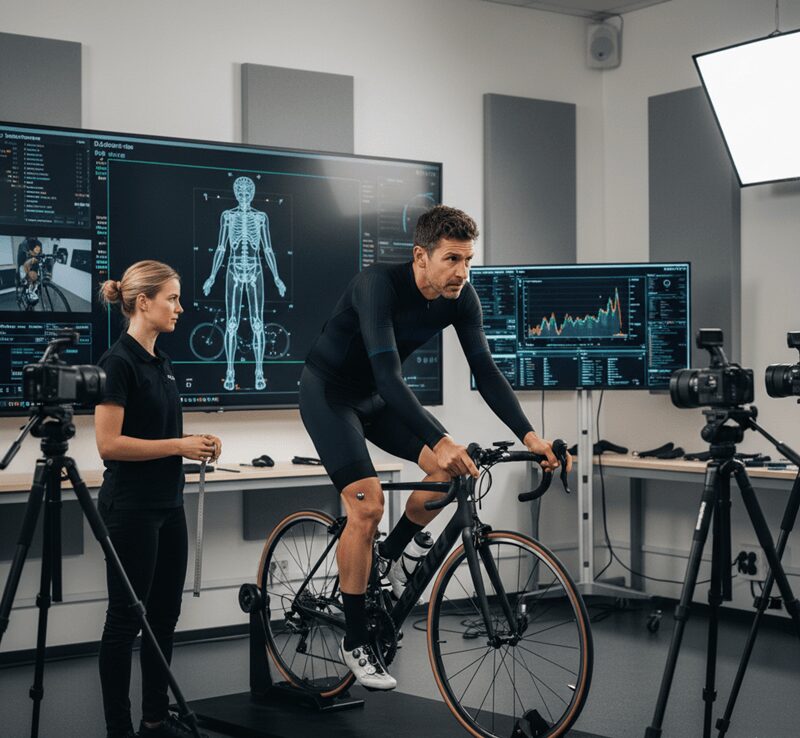
Professional Assessment Options
Lactate threshold testing provides precise training zones. Blood analysis reveals metabolic efficiency.
VO2 max testing identifies aerobic ceiling. This guides long-term development strategies.
Metabolic testing shows fat-burning capabilities. Improved fat oxidation enhances endurance.
Consider professional cycling performance assessment annually.
Goal Setting from Assessment Data

| Goal Type | Example | Timeline | Measurement |
| Power | Increase FTP 15W | 12 weeks | Monthly test |
| Endurance | Complete 100-mile ride | 16 weeks | Distance progression |
| Weight | Reduce 5kg body fat | 20 weeks | Weekly weigh-in |
| Technique | Eliminate dead spot | 8 weeks | Video analysis |
Cycling performance assessment guides achievable goal setting.
Tracking Progress Systematically
Maintain detailed training logs. Include subjective feelings alongside objective data.
Review progress monthly. Adjust training based on response patterns.
Celebrate improvements, however small. Consistent gains compound over time.
Regular cycling performance assessment maintains motivation.
Conclusion: Assessment Drives Success

Cycling performance assessment eliminates training guesswork. It reveals exactly what needs improvement.
Test regularly. Track meticulously. Adjust accordingly.
Your weaknesses are opportunities disguised as problems. Find them. Fix them. Get faster.
The fastest cyclists know their numbers. Now you will too.
James Hickman is a former Expert coach with USA Cycling who coached cyclists across all skill levels, from CAT 2 racers to intermediate and beginning riders. He also served as a coach for the Leukemia and Lymphoma Society’s Team In Training program, where he successfully trained individuals of varying abilities to complete century (100-mile) rides, combining his passion for cycling with meaningful community impact.
If you enjoyed this article please support this site! ☕️ Buy Me A Coffee (Support the Channel) https://buymeacoffee.com/cirp200ml
PRODUCTS TO ASSIST IN YOUR CYCLING PERFORMANCE ASSESSMENT
1. Garmin Rally RS200 Power Meter Pedals
Dual-sided power measurement with ±1% accuracy to identify power imbalances and track your true cycling strength. → Shop on Amazon
2. Wahoo TICKR Heart Rate Monitor
Bluetooth/ANT+ chest strap that reveals your cardiovascular efficiency and helps identify training zones. → Check Latest Price
3. Wahoo RPM Cadence Sensor
Magnet-free sensor that measures pedaling RPM to optimize your cycling efficiency and technique. → View on Amazon
4. Garmin Edge 840 Bike Computer
Advanced GPS computer that collects all your performance metrics and provides comprehensive training analysis. → Get Yours Today
We are an Amazon affiliate and earn from qualified Amazon purchases with no cost to you. This is for ANY product that you purchase through our links.
If you enjoyed learning about this week’s featured bicycle, don’t miss out on more classic bike goodness! Visit our website at classicjapanesebicycles.com for an extensive collection of timeless Japanese bikes and their unique stories. Plus, check out our YouTube channel, Bicycle Restoration Man, for detailed restoration videos and showcases of our finished projects. Subscribe and join our community of bike enthusiasts!